

Table of Contents
Opening comparison and context
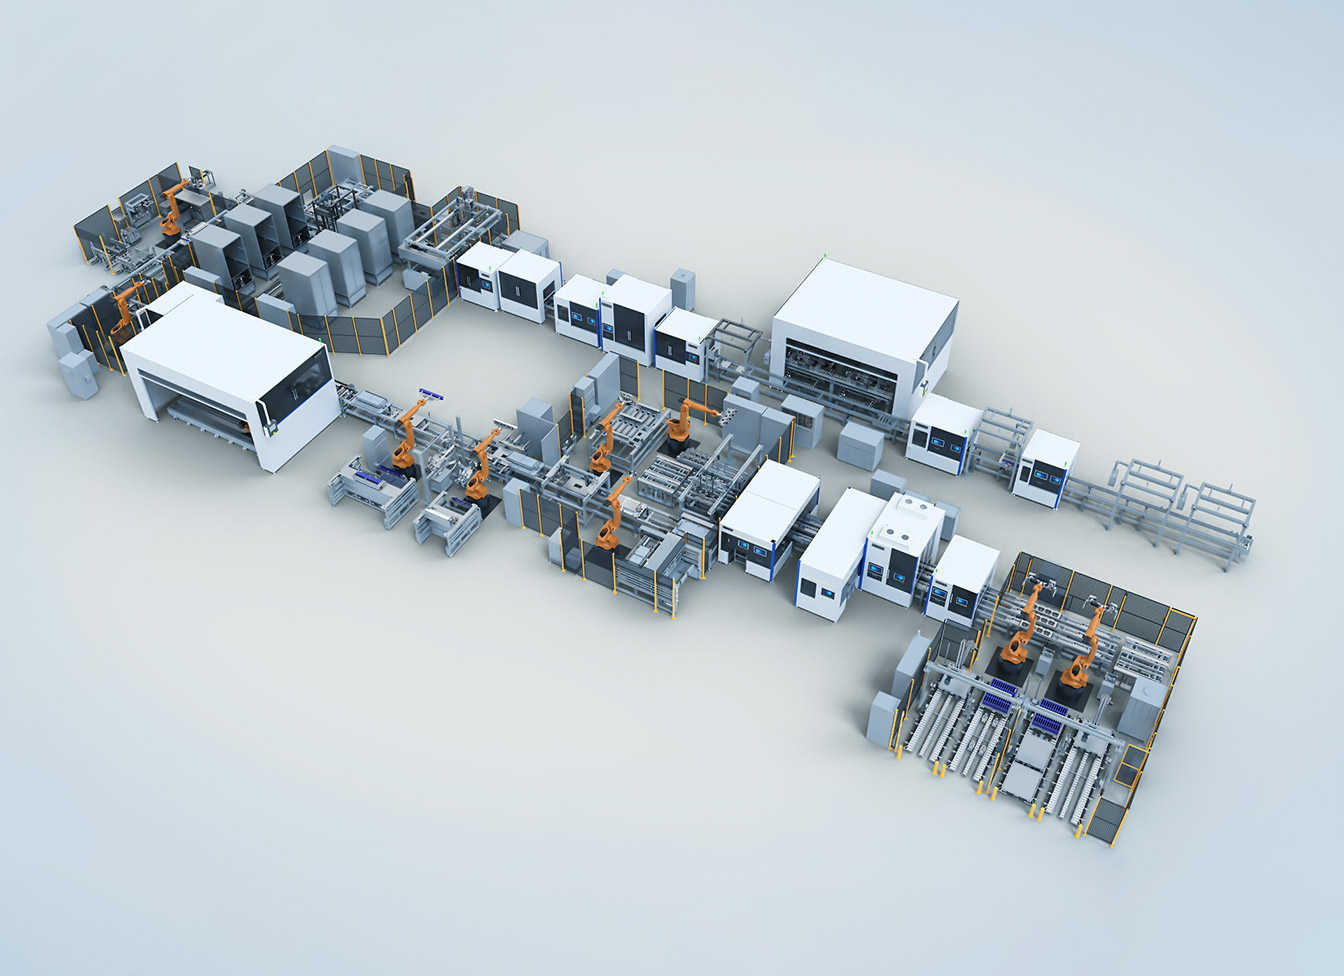
Start by lining up the assembly line options—manual, semi-automated, and fully automated—and score them against the same metrics. While you compare, check offerings from reliable prismatic battery pack assembly line suppliers to see real equipment specs and service scopes; direct supplier data helps reveal what’s standard and what’s add-on. This guide uses a side-by-side logic: each step asks you to compare two or three concrete variables so you make evidence-based tradeoffs rather than guesswork.

Quick comparison framework (how to read each step)
Compare each candidate line on throughput, yield, reproducibility, safety, maintainability, and supplier support. For every metric ask: “Which line gives the highest consistent performance under a 24/7 run?” and “Which one recovers fastest after faults?” Below you’ll find actions to take and simple measures to collect for apples-to-apples comparison.

Step 1 — Throughput versus cycle consistency
Measure cycle time and variation. A high throughput claim is meaningless if cycle-to-cycle variance is large. Collect:- average time per unit,- standard deviation across 100 cycles,- planned uptime percentage.Compare candidates by plotting average vs. variance. Prefer a slightly lower average with tight variance over a higher average with frequent spikes—predictability matters for downstream processes and quality control.
Step 2 — Yield, defect modes and inspection depth
Ask for defect logs and root-cause analyses for the latest six months. Key comparisons:- First-pass yield (FPY) on final assembly,- most common defect category (e.g., welding, lamination, sealing),- detection point for each defect (in-line vs. final test).Better lines push inspection earlier to remove bad parts before costly operations. If a supplier cannot show FPY trends and root causes, mark that line down.
Step 3 — Automation, tooling and process control
Compare control architecture and tooling redundancy. Look for:- closed-loop control on critical parameters (pressure, temperature, deposition),- tool redundancy for bottleneck stations,- traceable lot and serial number handling.Test the human–machine handover: watch one complete cycle with and without operator intervention. Lines that collapse when an operator steps away indicate brittle processes.
Step 4 — Thermal management, materials handling and safety
Compare cooling strategies and handling modes for prismatic cells. Check thermal uniformity reports and evidence of thermal run tests. Review safety systems: automated isolation, pressure relief paths, and solvent handling protocols. Verify the line’s emergency recovery procedures with a simulated fault; realistic recovery drills reveal practical safety readiness.
Step 5 — Test equipment, traceability and data quality
Side-by-side, examine test coverage and the granularity of logged data. Prefer lines that record per-unit timestamps, batch IDs, and a searchable fault history. Ask whether the test equipment is calibrated to recognized standards and how often. If data is coarse or stored in spreadsheets without timestamps, that line will hamper root-cause work later.
Step 6 — Supplier credibility and site evidence
Verify supplier claims by requesting on-site audits or video walkthroughs of active runs. Cross-check references, and if possible, review recent commissioning work in Shenzhen to see real-world throughput and aftercare. Also examine service contracts: compare guaranteed response times, spare-part lead times, and training provisions. Strong suppliers will show installation reports and measured KPIs rather than marketing slides.
Common pitfalls to avoid
Avoid these mistakes when comparing lines:- trusting peak throughput numbers without variance data,- ignoring how often operators must intervene,- accepting test coverage claims without seeing sample logs,- assuming identical cell handling across lines—method matters.Spot-check by asking for three recent unit IDs and walking through their production records end-to-end.
Decision checklist you can use during vendor demos
Bring this short checklist to each demo and score objectively:- Cycle time (mean ± SD): ______- FPY (last 6 months): ______- Most common defect: ______- Thermal uniformity results: ______- Data traceability depth (per-unit timestamps? Y/N): ______- Service SLA for critical faults: ______Use numeric scoring where possible; sum the scores to compare candidates fairly.
Alternatives and trade-offs
Semi-automated lines cost less upfront and are easier to modify, but expect higher operator dependence. Fully automated lines reduce human variability but require better upfront validation and stronger supplier support. Manual-focused setups can be useful for low-volume R&D runs but won’t scale without redesign. Match the choice to your volume plan and tolerance for process change.
Final synthesis
Compare lines step-by-step against measurable metrics, require documentary proof, and test on the shop floor where possible. The best decision balances steady throughput, demonstrable yield control, robust safety and clear data traceability. Practical vendor evidence and after-sales provisions matter most; that balance is the value FHS brings to assessments and integration planning: they show the measured outputs, not just promises, so you know exactly what you’re buying.
Also refer to industry resources about prismatic battery manufacturing when validating technical claims and calibration standards before final sign-off.
